| All residential (≥6 units) | Always-SFH (≥6 units) | All residential (≥2 units) | Always-SFH (≥2 units) | |
|---|---|---|---|---|
| Standard errors clustered by property. 95% confidence intervals in brackets. | ||||
| Multi-unit permit within 50m (≥6 units) | 0.0118 | 2.053e-04 | ||
| [0.0049, 0.0188] | [-0.0031, 0.0035] | |||
| Multi-unit permit within 50m (≥2 units) | 0.0374 | 0.0369 | ||
| [0.0340, 0.0409] | [0.0335, 0.0404] | |||
| Observations | 1,144,537 | 1,134,561 | 1,144,537 | 1,134,561 |
| Neighbourhood × year FE | X | X | X | X |
In a previous post, I showed some descriptive evidence that properties near new multi-unit buildings don’t appreciate less than properties farther away. That analysis was intentionally preliminary: comparing group medians year-by-year doesn’t account for the fact that infill tends to cluster in specific neighbourhoods, on specific lot types, and near properties that may already be on different value trajectories.
This post applies more rigorous methods to the same question. Using a first-difference event study design, I control for all time-invariant differences across properties (location, lot size, age, neighbourhood character) and for city-wide appreciation trends.
The answer is the same as the preliminary post: there is no evidence that multi-unit infill construction reduces nearby property values, across every specification.
Data
All data are from Edmonton’s open data portal.
- Historical property assessment data, 2015–2024. I filter for residential properties (
mill_class_1 == "RESIDENTIAL") with positive assessed values. - General building permit data, 2009–2025. Filtered using the same criteria as the preliminary post: permits adding ≥1 unit, excluding excavation-only permits.
- Mature neighbourhood boundaries (2024 vintage).
The treatment variable follows the preliminary post: a multi-unit building permit is one for ≥6 units, excluding new single-family homes, backyard houses, additions/conversions, and duplex-to-fourplex permits. A property is treated in assessment year \(t\) if such a permit was issued within 50m in year \(t - 1\), giving time for the building’s presence to be reflected in assessed value.
The sample is restricted to mature neighbourhoods (excluding Downtown), where infill has been most active.
Methods
The preliminary post compared median property value changes between a “treated” group (nearby multi-unit permit) and a “control” group. The limitation is that treated and control properties may differ systematically: infill tends to cluster in specific neighbourhoods, on certain street types, and near properties that may already be on different value trajectories.
A first-difference (FD) approach addresses this by using each property’s year-over-year change in log assessed value as the outcome. Time-invariant differences between properties — location, lot size, year built — cancel out in differencing, because they affect value levels equally in every year. A neighbourhood × year fixed effect absorbs both city-wide appreciation trends and neighbourhood-specific appreciation dynamics, comparing treated and control properties within the same neighbourhood in the same year. This removes bias from infill clustering in already-appreciating areas. The parallel trends assumption is weaker than in a levels regression: it requires only that treated and control properties within the same neighbourhood would have appreciated at similar rates absent treatment, not that they were on parallel value levels.
The event study estimates separate effects at each point in time relative to the first nearby permit: \(t = -4, -3, -2, -1\) (pre-treatment), and \(t = 0, +1, +2, +3, +4\) (post-treatment). If the parallel trends assumption holds — i.e., treated and control properties in the same neighbourhood would have followed similar appreciation rate trajectories absent treatment — the pre-treatment coefficients should be near zero. Flat pre-trends are not proof of causality, but they are necessary evidence for it.
I use the Sun-Abraham (2021) estimator (sunab() in the fixest package), which is robust to heterogeneous treatment effects across cohorts — important here because properties receive their first nearby permit in different years throughout 2015–2024.
Results
Each analysis below is shown for two samples side by side. The all residential sample covers all residential properties in mature neighbourhoods. The always-SFH sample excludes any property that ever had a ≥6-unit permit issued within 10m of itself during the study period — removing properties approaching redevelopment, which tend to be assessed near land value and cluster near new infill. The always-SFH sample most directly answers the policy question: does building apartments next door hurt my house’s value?
The always-SFH estimates (both thresholds) are near zero — consistent with no effect on stable single-family homes. The all-residential estimates are near zero or slightly positive: properties near new multi-unit permits appreciate at similar or slightly faster rates on average, not slower. The ≥2-unit columns show that the null result holds for smaller infill types (including duplex-to-fourplex), not just large apartment buildings.
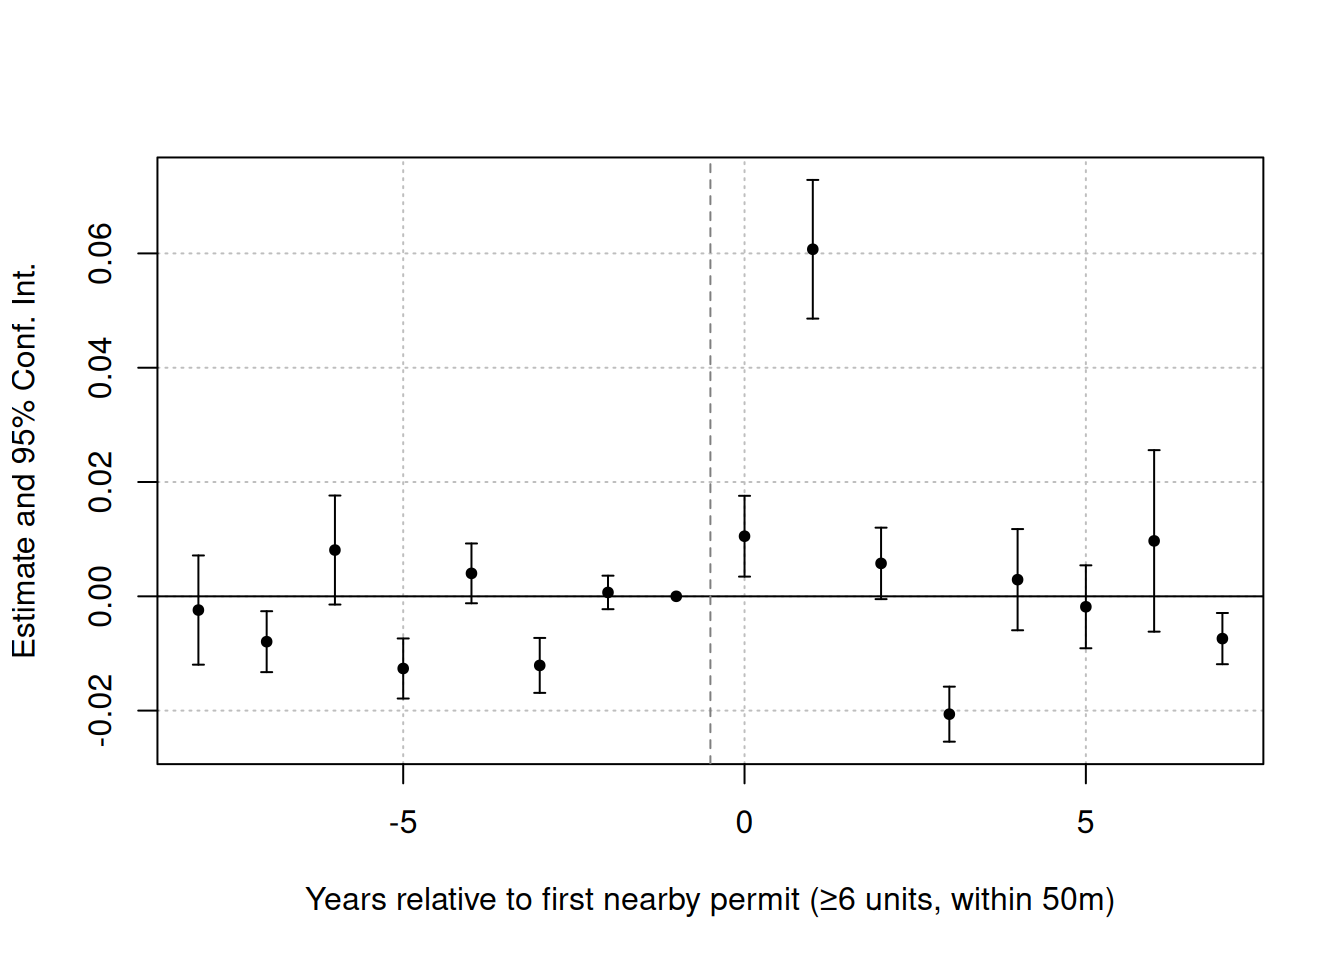
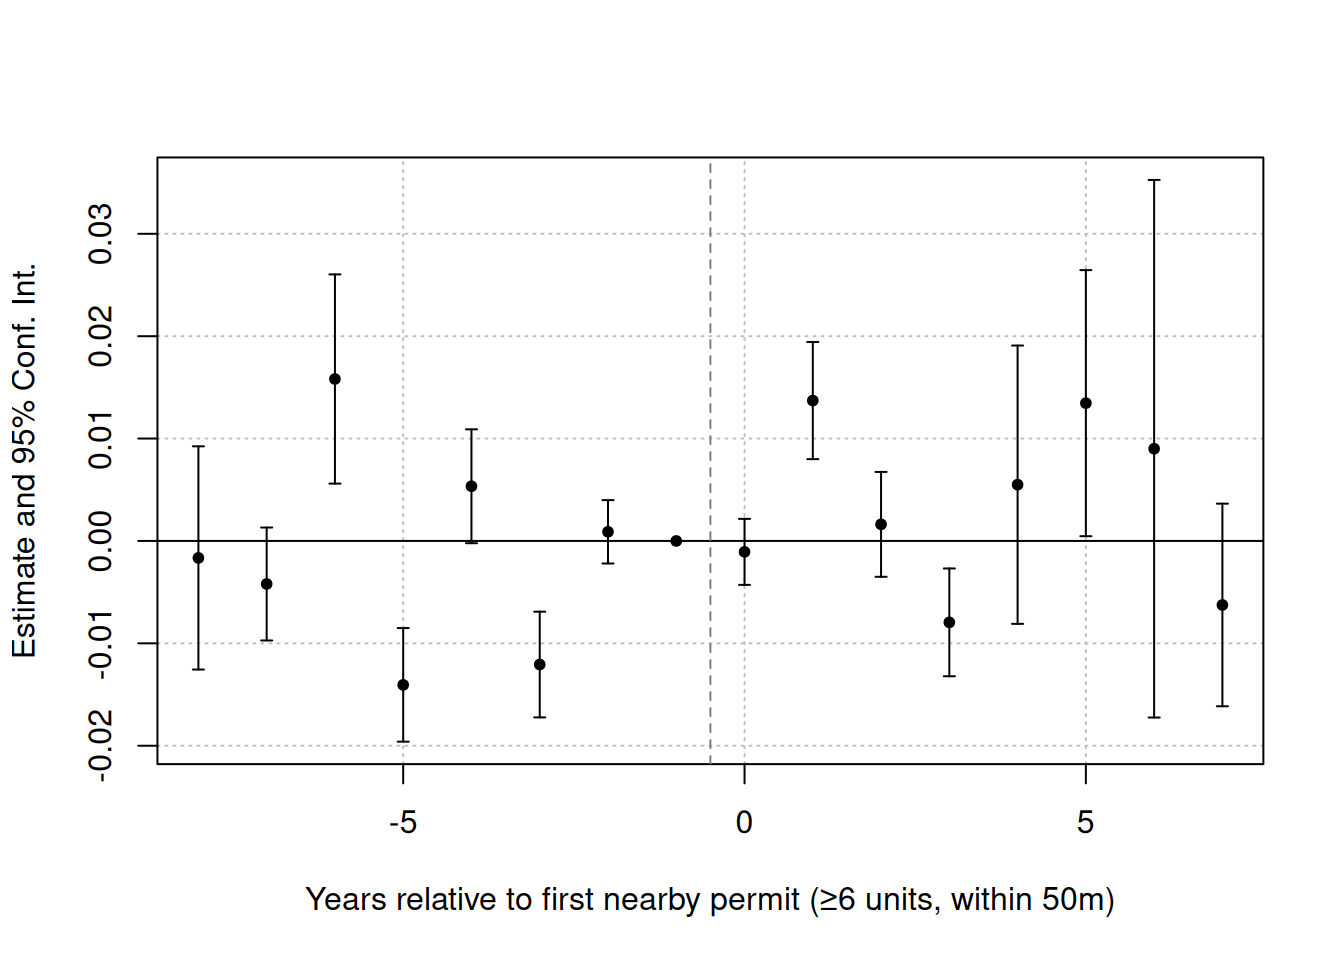
The first-difference event studies (Figure 1 and Figure 2) test whether appreciation rates were diverging before treatment. The always-SFH pre-trends are flat, and post-treatment estimates are near zero throughout — a clean null result. The all-residential event study tells a more revealing story: there is a large positive spike at \(t = 0\), which then reverts to near zero. This spike is almost certainly driven by properties approaching redevelopment in the all-residential sample: when a multi-unit permit appears nearby, properties that are themselves candidates for demolition see an immediate reassessment of their land value. The always-SFH exclusion removes this effect entirely, confirming that stable single-family homes see no change in appreciation rates. See Table 2 for treated-observation counts by cohort and relative year.
| Cohort |
Pre-treatment (relative year)
|
Post-treatment (relative year)
|
|||||||||||||||
|---|---|---|---|---|---|---|---|---|---|---|---|---|---|---|---|---|---|
| -8 | -7 | -6 | -5 | -4 | -3 | -2 | -1 | 0 | +1 | +2 | +3 | +4 | +5 | +6 | +7 | +8 | |
| All residential | |||||||||||||||||
| 2015 | — | — | — | — | — | — | — | — | — | 95 | 95 | 95 | 95 | 95 | 95 | 95 | 95 |
| 2016 | — | — | — | — | — | — | — | — | 31 | 31 | 31 | 31 | 31 | 31 | 31 | 31 | 31 |
| 2017 | — | — | — | — | — | — | — | 5 | 5 | 40 | 40 | 40 | 40 | 40 | 40 | 40 | — |
| 2018 | — | — | — | — | — | — | 14 | 14 | 14 | 21 | 21 | 21 | 21 | 21 | 21 | — | — |
| 2019 | — | — | — | — | — | 9 | 9 | 9 | 9 | 9 | 9 | 9 | 9 | 9 | — | — | — |
| 2020 | — | — | — | — | 24 | 24 | 24 | 25 | 27 | 27 | 27 | 27 | 27 | — | — | — | — |
| 2021 | — | — | — | 123 | 123 | 124 | 124 | 127 | 127 | 127 | 127 | 127 | — | — | — | — | — |
| 2022 | — | — | 137 | 138 | 138 | 141 | 141 | 143 | 143 | 153 | 153 | — | — | — | — | — | — |
| 2023 | — | 293 | 298 | 302 | 304 | 306 | 310 | 311 | 313 | 319 | — | — | — | — | — | — | — |
| 2024 | 356 | 357 | 367 | 368 | 375 | 379 | 385 | 387 | 387 | — | — | — | — | — | — | — | — |
| Always-SFH | |||||||||||||||||
| 2015 | — | — | — | — | — | — | — | — | — | 23 | 23 | 23 | 23 | 23 | 23 | 23 | 23 |
| 2016 | — | — | — | — | — | — | — | — | 31 | 31 | 31 | 31 | 31 | 31 | 31 | 31 | 31 |
| 2017 | — | — | — | — | — | — | — | 5 | 5 | 5 | 5 | 5 | 5 | 5 | 5 | 5 | — |
| 2018 | — | — | — | — | — | — | 14 | 14 | 14 | 14 | 14 | 14 | 14 | 14 | 14 | — | — |
| 2019 | — | — | — | — | — | 9 | 9 | 9 | 9 | 9 | 9 | 9 | 9 | 9 | — | — | — |
| 2020 | — | — | — | — | 23 | 23 | 23 | 24 | 26 | 26 | 26 | 26 | 26 | — | — | — | — |
| 2021 | — | — | — | 120 | 120 | 121 | 121 | 124 | 124 | 124 | 124 | 124 | — | — | — | — | — |
| 2022 | — | — | 134 | 135 | 135 | 137 | 137 | 139 | 139 | 139 | 139 | — | — | — | — | — | — |
| 2023 | — | 275 | 280 | 284 | 286 | 288 | 292 | 295 | 295 | 297 | — | — | — | — | — | — | — |
| 2024 | 307 | 308 | 317 | 318 | 325 | 329 | 335 | 335 | 335 | — | — | — | — | — | — | — | — |
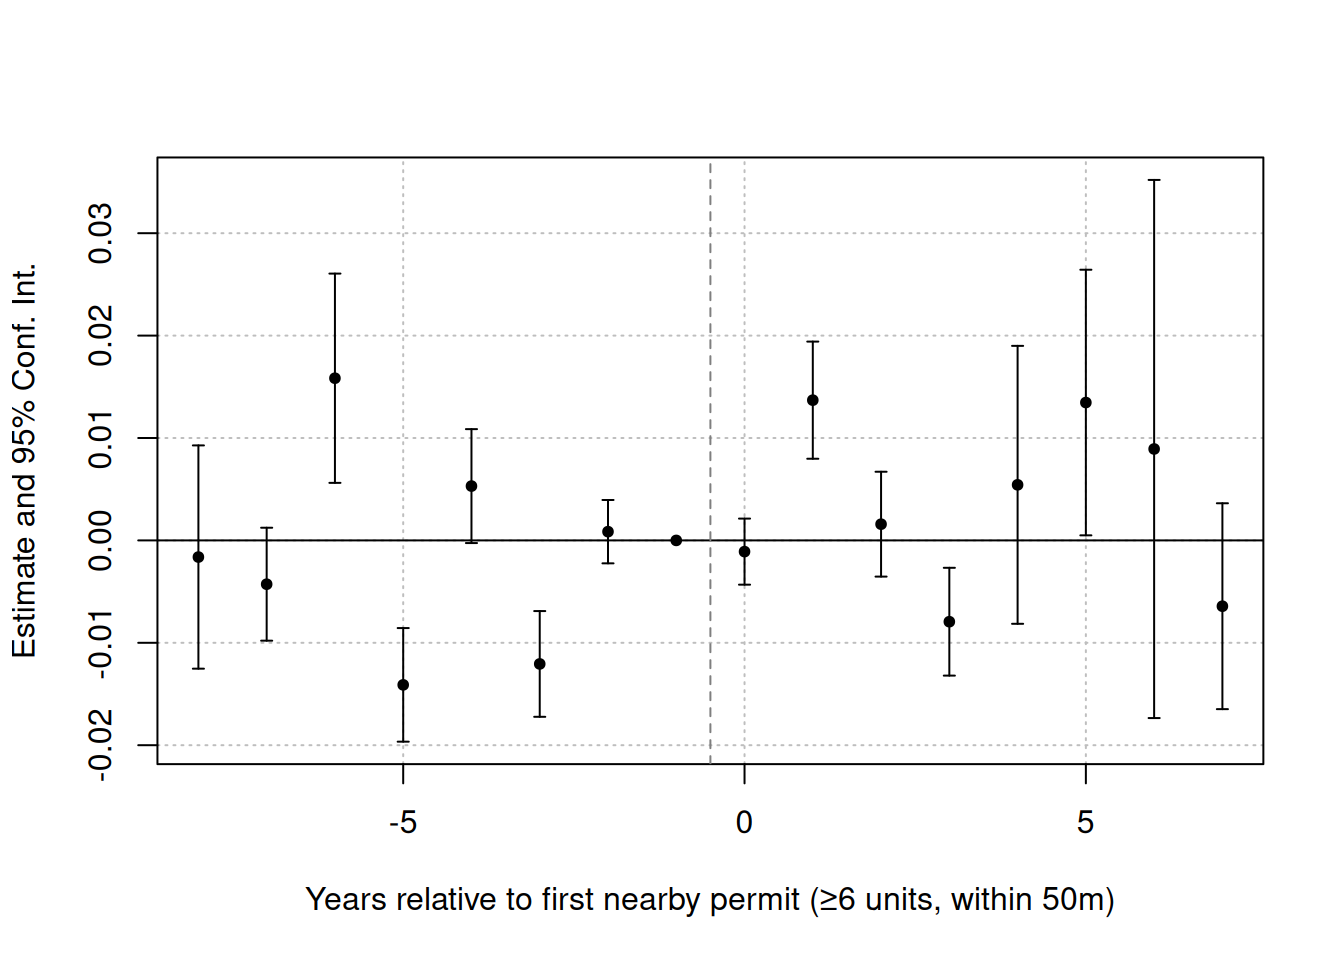
Figure 3 repeats the always-SFH FD event study restricted to cohorts 2017 and later — the earliest cohort with at least one pre-treatment FD observation. The result is unchanged: all estimates are statistically indistinguishable from zero throughout the full time horizon, with no systematic trend.
Caveats
Parallel trends is untestable. Flat pre-trends are necessary but not sufficient evidence for a causal interpretation. A time-varying confounder that begins exactly when the permit is issued — say, a developer specifically targeting blocks that are about to appreciate for unrelated reasons — could still bias the estimates. The flat pre-trends make this story less plausible, but it cannot be ruled out.
Developer selection likely biases toward finding a positive effect. If developers preferentially site multi-unit builds near properties that are already appreciating (e.g., near amenities, on major streets), the “treated” group would be expected to appreciate faster even without the infill. This would work against finding a null result, making the null finding more conservative, not less.
Assessed value is not sale price. Edmonton’s assessment data reflects the city’s model of market value, not observed transactions. City-wide assessment methodology changes are absorbed by year fixed effects, but property-specific reassessment events are not. Using only properties where the same assessment method applies across all years would be a useful robustness check.
One-year lag. The treatment indicator uses permits issued in year \(t-1\) to predict assessments in year \(t\). Construction timelines vary — larger buildings may take two or more years to complete — so some effects may be lagged further than the specification captures. The event study, which shows no effect even 4+ years post-permit, addresses this concern.
The always-SFH sample conditions on an endogenous outcome. The always-SFH sample excludes properties that were themselves eventually redeveloped within 10m of a ≥6-unit permit during the study period. If infill pressure causes adjacent properties to sell and redevelop, this exclusion removes potentially affected properties. The always-SFH estimates should therefore be interpreted as the effect on properties that did not experience redevelopment pressure — a well-defined and policy-relevant group, but not a random subset. The bias direction is ambiguous but likely toward a more null result.
Conclusion
Using year-over-year appreciation as the outcome, there is no evidence that multi-unit infill construction reduces neighbouring property values in Edmonton’s mature neighbourhoods. The always-SFH estimates are near zero across both the ≥6-unit and ≥2-unit thresholds, and the all-residential estimates are near zero or slightly positive. The event study shows flat pre-trends and no post-treatment decline for stable single-family homes across the full post-treatment window. The all-residential sample does show a large positive spike at \(t = 0\), almost certainly driven by properties approaching redevelopment being reassessed at land value — but this is a selection artefact that disappears in the always-SFH sample, confirming that stable homes are unaffected. All specifications use neighbourhood × year fixed effects, comparing treated and control properties within the same neighbourhood and year.
This is consistent with the preliminary post and with a growing literature finding that upzoning and infill construction do not harm existing homeowners. The fear that new apartments will hurt house prices is not supported by Edmonton’s own data. It should not be a reason to restrict where housing can be built.